by Keith Gladstone
Only the best players of a given era are inducted into the National Baseball Hall of Fame in Cooperstown, from classic names like Babe Ruth and Lou Gehrig, to the most recent nominees of Mike Piazza and Ken Griffey Jr. Since the MLB era tainted by PEDs saw unthinkable, sky-high hitting totals, the question of who deserves a seat in the Hall of Fame is open for debate. The great differences in eras alone can convolute our interpretation of the game’s statistics, so in this article I will introduce a method of comparison.
Indeed, I did an analysis to normalize the career HR totals of all Hall of Famers based on their historical era. Babe Ruth held the career home run record at 714 upon retiring in 1935. Hank Aaron shattered the record almost 40 years years later, but what does this actually mean? Was Hank Aaron better than Babe Ruth?
I calculated a new statistic to measure a player’s HR performance relative to the era in which they played. I call it the “Home Runs to Benchmark Ratio.”
HR to Benchmark Ratio = Annual Career HR Average / HR Era Benchmark
- A ratio of 1 means the player was an average home run hitter in his own era.
- A ratio of 2 means the player hit twice as many HR as the average player.
Pitching dominated the game in the “Dead Ball Era,” which ended upon the emergence of Babe Ruth and the Bronx Bombers in the 1920s. 714 HR in an era when the average player hit only 100 HR in a career underscores how impressive Ruth’s prowess was.
The Home Run to Benchmark Ratio rankings below confirm this, with Babe Ruth miles above the rest, followed by other classic Yankee heroes Lou Gehrig and Joe DiMaggio. Stunningly, Hank Aaron does not even crack the top ten. His ratio is 2.48, leaving him 26th overall. The HR performances of The Great Bambino, The Iron Horse, and The Yankee Clipper relative to their contemporaries shows just how incredible they must have been to watch.
MLB HOF All-time HR Rankings - Normalized by Era
| MidYear | Name | Career HR | HR to Benchmark Ratio | |
| 1 | 1924 | Babe Ruth | 714 | 7.13 |
| 2 | 1931 | Lou Gehrig | 493 | 4.76 |
| 3 | 1944 | Joe DiMaggio | 361 | 4.45 |
| … | … | … | … | … |
| 25 | 1964 | Harmon Killebrew | 573 | 2.49 |
| 26 | 1965 | Hank Aaron | 755 | 2.48 |
| 27 | 1950 | Ted Williams | 521 | 2.43 |
| 28 | 1935 | Earl Averill | 238 | 2.37 |
| 29 | 1960 | Mickey Mantle | 536 | 2.33 |
| 30 | 1975 | Johnny Bench | 389 | 2.31 |
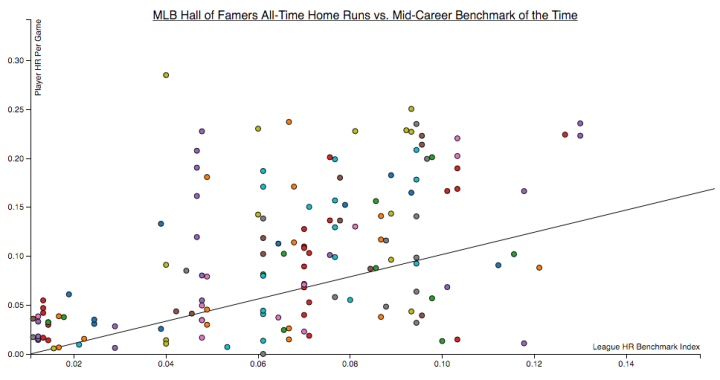
Below is a graph of career HR per game against the average HR per game in that era . Players that appear above the line toward the top-left have higher ratios. Babe Ruth is the top left point.
Appendix
The following assumptions were made for data collection and analysis:
- Player performance is symmetrical over time with a peak in the middle of the player’s career
- League averages are decent estimates of the “benchmark” over which a player could measure
- This analysis will consider the modern era (Hall of Famers whose careers occurred mostly after 1900) and those with career batting averages above 0.250
- Since Hall of Famers had relatively long careers, their statistics are reliable estimates of their abilities
Using the “middle year” as a barometer for a player’s peak
Since the number of players in this dataset is so large, we need a simplified way to capture a player’s top-performing year. For this analysis, we can take the player’s career totals and divide by the number of years played to get a yearly average for the player, and measure this average against the benchmark for the year (selected as the middle year of the player’s career). While this analysis is therefore not perfectly rigorous, it stills serves as a useful method for comparing players from different eras. Put another way, the performance benchmark in 1995 should be similar enough to 1997, and the benchmarks in the 1990s are different enough from those in the 1920s where a benchmark a few years off wouldn’t be a significant issue.

Why omit #4 - 24?